Debugging quick look and contour wind stick plots
The quick look plots on the public Oasis data page (http://www.mbari.org/oasis/qc/index.html) are created by the SSDS-driven NetCDF processing that runs on elvis every 2 hours. To start with understanding the processing look at the crontab for the ssdsadmin account on elvis. There are some notes in the TROUBLESHOOT file in /u/ssdsadmin/dev/DPforSSDS/cimt to help with running the main scripts (DStoNetCDF.pl, combineTS.pl, combineMet.pl, combineAll.pl) for a specific deployment. All of the Perl code that builds the Ferret .jnl files which produce the plots are in the ssds_util.pl library. In addition all of the processing is reported to SSDS with DataProducers with the plots files generated recorded as Resources. One could search and walk through the processing provenance in SSDS to find the script that produced a plot.
A "side effect" of the main processing is the creation of the current_qcPlots.html web page produced for each mooring that is processed. This page has some short-cut links to the Ferret scripts (jnl files) that produce the plots. All of the pages linked in the Plots column ('full Deployment' and 'last 7 days') have a link at the top that points to the .jnl file that produced the plots on the page. The Ferret commands can be copy and pasted from the jnl page into a ferret session. I suggest running ferret on elvis and remoting the X-Display to your computer.
The "Last 30 day Wind Temperature contour" and "Last 30 day Wind Salinity contour" GIF images are created by a jnl file that is in the same directory as the images. Edit the URL to examine the contents or the directory and see the Ferret commands that produce the plot. It's helpful to copy the USE and SET REGION commands from the .jnl page into a ferret session and examine the data to debug what might be wrong in producing the plots.
A. Initial look at the data
Here's an example of doing this (with the SET REGION command edited to list just the last day's data) - the problem being analyzed is gappy subsurface data:
 > ferret
        NOAA/PMEL TMAP
        FERRET v6.62
        Linux rh5 (gfortran) 2.6.18-164.11.1.el5 - 06/11/10
        30-May-11 21:59

yes? USE "http://dods.mbari.org/opendap/data/ssdsdata/deployments/m1/201010/OS_M1_20101027hourly_CMSTV.nc"
yes? SET REGION/T="30-May-2011 04:43":"31-May-2011 04:43"
yes? list sea_water_temperature_hr
             VARIABLE : Sea Water Temperature (Celsius)
             DATA SET : Hourly Gridded MBARI Mooring M1 Sea Water Temperature and Salinity Observations
             FILENAME : OS_M1_20101027hourly_CMSTV.nc
             FILEPATH : http://dods.mbari.org/opendap/data/ssdsdata/deployments/m1/201010/
             SUBSET   : 11 by 24 points (DEPTH (m)-TIME)
             LONGITUDE: 122W(-122)
             LATITUDE : 36.8N
                             1      10     20     40     60     80    100    150    200    250    300
                              1      2      3      4      5      6      7      8      9     10     11
 30-MAY-2011 04:30 / 5145:  10.77   ....   ....   ....   ....   ....   ....   ....   ....   ....   ....
 30-MAY-2011 05:30 / 5146:  10.69   ....   ....   ....   ....   ....   ....   ....   ....   ....   ....
 30-MAY-2011 06:30 / 5147:  10.59   ....   ....   ....   ....   ....   ....   ....   ....   ....   ....
 30-MAY-2011 07:30 / 5148:  10.49   ....   ....   ....   ....   ....   ....   ....   ....   ....   ....
 30-MAY-2011 08:30 / 5149:  10.42   ....   ....   ....   ....   ....   ....   ....   ....   ....   ....
 30-MAY-2011 09:30 / 5150:  10.29   ....   ....   ....   ....   ....   ....   ....   ....   ....   ....
 30-MAY-2011 10:30 / 5151:  10.23   ....   ....   ....   ....   ....   ....   ....   ....   ....   ....
 30-MAY-2011 11:30 / 5152:  10.33   ....   ....   ....   ....   ....   ....   ....   ....   ....   ....
 30-MAY-2011 12:30 / 5153:  10.35   ....   ....   ....   ....   ....   ....   ....   ....   ....   ....
 30-MAY-2011 13:30 / 5154:  10.34   ....   ....   9.56   9.08   8.85   8.39   8.10   7.89   7.59   7.51
 30-MAY-2011 14:30 / 5155:  10.36   ....   ....   9.28   8.92   8.70   8.46   8.12   7.90   7.60   7.51
 30-MAY-2011 15:30 / 5156:  10.38   ....   ....   9.26   8.92   8.73   8.39   8.11   7.93   7.67   7.50
 30-MAY-2011 16:30 / 5157:  10.45   ....   ....   9.38   9.04   8.81   8.38   8.11   7.93   7.68   7.49
 30-MAY-2011 17:30 / 5158:  10.50   ....   ....   9.55   9.13   8.89   8.64   8.15   7.96   7.68   7.49
 30-MAY-2011 18:30 / 5159:  10.76   ....   ....  10.16   9.14   8.90   8.71   8.26   7.97   7.67   7.49
 30-MAY-2011 19:30 / 5160:  11.06   ....   ....  10.15   9.10   8.91   8.69   8.25   7.98   7.69   7.50
 30-MAY-2011 20:30 / 5161:  11.33   ....   ....  10.18   9.07   8.90   8.61   8.21   8.01   7.69   7.49
 30-MAY-2011 21:30 / 5162:  11.37   ....   ....   9.75   9.03   8.83   8.50   8.24   7.99   7.69   7.49
 30-MAY-2011 22:30 / 5163:  11.10   ....   ....   9.85   9.04   8.83   8.51   8.27   7.99   7.69   7.50
 30-MAY-2011 23:30 / 5164:  11.05   ....   ....   ....   ....   ....   ....   ....   ....   ....   ....
 31-MAY-2011 00:30 / 5165:  10.90   ....   ....   ....   ....   ....   ....   ....   ....   ....   ....
 31-MAY-2011 01:30 / 5166:  10.84   ....   ....   ....   ....   ....   ....   ....   ....   ....   ....
 31-MAY-2011 02:30 / 5167:  10.59   ....   ....   ....   ....   ....   ....   ....   ....   ....   ....
 31-MAY-2011 03:30 / 5168:  10.37   ....   ....   ....   ....   ....   ....   ....   ....   ....   ....
The many '....'s indicate missing data in this hourly gridded file. Let's look upstream in the data processing to see what the input data looks like. The .jnl file that created the 201010/OS_M1_20101027hourly_CMSTV.nc file simply USEd the TS data. Listing the data from the TS file shows the same gappy data as above. So let's look at the input data to the TS file. The jnl file link in the Data column in the [TS: ] row. Listing the data from the individual input files shows that they apparently do not have the gaps that are shown int he gridded data set:
yes? USE "http://dods.mbari.org/opendap/data/ssdsdata/deployments/m1/201010/m1_ctd0010_20101027_original.nc"
yes? list temperature
             VARIABLE : Water Temperature (deg C)
             DATA SET : Mooring M1 CTD data from MBARI instrument id 1491 at original sampling intervals
             FILENAME : m1_ctd0010_20101027_original.nc
             FILEPATH : http://dods.mbari.org/opendap/data/ssdsdata/deployments/m1/201010/
             SUBSET   : 140 points (TIME)
             LONGITUDE: 122W(-122)
             LATITUDE : 36.8N
             DEPTH (m): 10
                                122W
                                  1
 30-MAY-2011 04:49:31 / 30019:  10.73
 30-MAY-2011 04:59:30 / 30020:  10.72
 30-MAY-2011 05:09:31 / 30021:  10.70
 30-MAY-2011 05:19:29 / 30022:  10.70
 30-MAY-2011 05:29:30 / 30023:  10.69
 30-MAY-2011 05:39:31 / 30024:  10.69
(records skipped)
 31-MAY-2011 02:59:30 / 30152:  10.12
 31-MAY-2011 03:09:31 / 30153:  10.06
 31-MAY-2011 03:19:30 / 30154:  10.08
 31-MAY-2011 03:29:30 / 30155:  10.07
 31-MAY-2011 03:39:29 / 30156:  10.06
 31-MAY-2011 03:49:31 / 30157:  10.08
 31-MAY-2011 03:59:30 / 30158:  10.05
B. Tips for debugging with Ferret
To figure out what is going wrong we'll need to execute more of the Ferret commands from the jnl file that creates the TS file and examine the data at each step. This is an interactive process that involves editing a temporary .jnl file, executing it in ferret with a "GO <jnl_file>" and analyzing the output. Here are some more tips for diagnosing problems:
- Examine the production ferret output - this is the 'out' link on the current_qcPlots.html web page
- Examine CVS for changes in the source code - the change log for combineTS.pl (the script that produces the jnl file link in the Data column in the [TS: ] row) is http://moonjelly.shore.mbari.org/cgi-bin/viewvc.cgi/DPforSSDS/cimt/combineTS.pl?view=log
- Examine the data and plots for the individual microcats on the current_qcPlots.html web page
- Read the excellent online Ferret documentation, starting with the "Thinking like a Ferret" page: http://ferret.pmel.noaa.gov/Ferret/documentation/users-guide/introduction/GETTING-STARTED
To follow through with this example of gappy data I took these steps:
- Copied the OS_MBARI-M1_20101027_R_TS.jnl file from it's production location (/mbari/ssdsdata/deployments/m1/201010) to /tmp
- Edited the file to process and save only the 1m and 10m data and save the date to a temporary netcdf file in /tmp
- Executed the temporary truncated file from a Ferret session
yes? go "/tmp/OS_MBARI-M1_20101027_R_TS.jnl"
! Description: Produce netCDF file of all Temperature and Salinity measurements from a mooring
!              Pull data from original instrument netCDF files and grid onto a common grid.
!              Automatically generated by ./combineTS.pl on Tue May 31 09:37:27 2011.
!              For information on Ferret see http://ferret.wrc.noaa.gov/Ferret/.
!

<snip>

SAVE/FILE="/tmp/OS_MBARI-M1_20101027_R_TS.nc"/APPEND/KLIMITS=1:11/LLIMITS=1:`PSAL,return=lend`/Z=1/T="27-Oct-2010 21:00:00":"31-May-2011 16:00:00" PSAL,
PSAL_QC, TEMP, TEMP_QC, TIME_QC, POSITION_QC, DEPTH_QC
 !-> LIST/FORMAT=CDF/FILE="/tmp/OS_MBARI-M1_20101027_R_TS.nc"/APPEND/KLIMITS=1:11/LLIMITS=1:5182/Z=1/T="27-Oct-2010 21:00:00":"31-May-2011 16:00:00" PSAL,
PSAL_QC, TEMP, TEMP_QC, TIME_QC, POSITION_QC, DEPTH_QC
 LISTing to file /tmp/OS_MBARI-M1_20101027_R_TS.nc

<snip>

SAVE/FILE="/tmp/OS_MBARI-M1_20101027_R_TS.nc"/APPEND/Z=10/T="27-Oct-2010 20:00:00":"31-May-2011 15:00:00" PSAL, PSAL_QC, TEMP, TEMP_QC, TIME_QC, POSITION_QC, DEPTH_QC
 LISTing to file /tmp/OS_MBARI-M1_20101027_R_TS.nc
 **TMAP ERR: error in line definition
             disordered output coordinate value:  22215.      Axis: TIME
LIST/FORMAT=CDF/FILE="/tmp/OS_MBARI-M1_20101027_R_TS.nc"/APPEND/Z=10/T="27-Oct-2010 20:00:00":"31-May-2011 15:00:00" PSAL, PSAL_QC, TEMP, TEMP_QC, TIME_QC, POSITION_QC, DEPTH_QC
Command file, command group, or REPEAT execution aborted
yes?
This looks like a good clue. The 10m data are not being written to the output file and we are getting this obscure "disordered output coordinate value" error from Ferret. We need to get to the bottom of this. Here are some more tips on how to proceed:
- Use the Ferret mail list archive () or Google to search for the meaning of this error message
- Join the Ferret mail list and post your question. Solutions are typically provided within a day.
- Examine the input data and variables using ncdump(1) or Ferret LIST and SHOW commands
Here are some Ferret commands to examine the first 3 temperature values from the 1m and 10m input CTD data and the first 3 times of the output axis:
yes? list/l=1:3/d=1 temperature
             VARIABLE : Water Temperature (deg C)
             DATA SET : Mooring M1 CTD data from MBARI instrument id 1338 at original sampling intervals
             FILENAME : m1_ctd0001_20101027_original.nc
             FILEPATH : http://dods.mbari.org/opendap/data/ssdsdata/deployments/m1/201010/
             SUBSET   : 3 points (TIME)
             LONGITUDE: 122W(-122)
             LATITUDE : 36.8N
             DEPTH (m): 1
                            122W
                              1
 27-OCT-2010 21:08:43 / 1:  14.01
 27-OCT-2010 21:22:27 / 2:  14.10
 27-OCT-2010 21:28:23 / 3:  14.10
yes? list/l=1:3/d=2 temperature
             VARIABLE : Water Temperature (deg C)
             DATA SET : Mooring M1 CTD data from MBARI instrument id 1491 at original sampling intervals
             FILENAME : m1_ctd0010_20101027_original.nc
             FILEPATH : http://dods.mbari.org/opendap/data/ssdsdata/deployments/m1/201010/
             SUBSET   : 3 points (TIME)
             LONGITUDE: 122W(-122)
             LATITUDE : 36.8N
             DEPTH (m): 10
                            122W
                              1
 27-OCT-2010 20:11:17 / 1:  13.38
 27-OCT-2010 20:21:16 / 2:  13.59
 27-OCT-2010 20:31:16 / 3:  13.45
yes? show/l=1:3 axis time
 name       axis              # pts   start                end
 TIME      TIME              5181 r   27-OCT-2010 20:30    31-MAY-2011 16:30
T0 = 01-JAN-1950 00:00:00
   Axis span (to cell edges) = 215.875

       L     T                   TBOX      TBOXLO                TSTEP (DAYS)
       1>  27-OCT-2010 20:30:00  0.0416667  27-OCT-2010 20:00:00    22214.85
       2>  27-OCT-2010 21:30:00  0.0416667  27-OCT-2010 21:00:00    22214.9
       3>  27-OCT-2010 22:30:00  0.0416667  27-OCT-2010 22:00:00    22214.94
C. Fixing the start times for all the child instrument deployments
The problem seems to be that the 10m data begin at 20:11:17 before the 1m data at 21:08:43. The first write of the 1m data to the output netCDF file gives the file its shape with the KLIMITS= and LLIMITS= options. Writing the 10m data, which begins in before the bounds that were defined violates Ferret's axis ordering logic. To test this hypothesis edit the SAVE statement in the temporary .jnl file to make the start time for the 10m data 21:00, execute it and then examine the output file:
yes? go "/tmp/OS_MBARI-M1_20101027_R_TS.jnl"

<snip>

SAVE/FILE="/tmp/OS_MBARI-M1_20101027_R_TS.nc"/APPEND/Z=10/T="27-Oct-2010 21:00:00":"31-May-2011 15:00:00" PSAL, PSAL_QC, TEMP, TEMP_QC, TIME_QC, POSITION_QC, DEPTH_QC
 LISTing to file /tmp/OS_MBARI-M1_20101027_R_TS.nc

(Another ferret session)
> ferret
        NOAA/PMEL TMAP
        FERRET v6.62
        Linux rh5 (gfortran) 2.6.18-164.11.1.el5 - 06/11/10
        31-May-11 12:19

yes? use "/tmp/OS_MBARI-M1_20101027_R_TS.nc"
yes? list/l=1:10 temp
             VARIABLE : Hourly sea_water_temperature (celsius)
             FILENAME : OS_MBARI-M1_20101027_R_TS.nc
             FILEPATH : /tmp/
             SUBSET   : 11 by 10 points (DEPTH (m)-TIME)
             LONGITUDE: 122W(-122)
             LATITUDE : 36.8N
                           1      10     20     40     60     80    100    150    200    250    300
                            1      2      3      4      5      6      7      8      9     10     11
 27-OCT-2010 21:30 /  1:  14.09  13.60   ....   ....   ....   ....   ....   ....   ....   ....   ....
 27-OCT-2010 22:30 /  2:  14.17  13.62   ....   ....   ....   ....   ....   ....   ....   ....   ....
 27-OCT-2010 23:30 /  3:  14.34  13.63   ....   ....   ....   ....   ....   ....   ....   ....   ....
 28-OCT-2010 00:30 /  4:  14.28  13.69   ....   ....   ....   ....   ....   ....   ....   ....   ....
 28-OCT-2010 01:30 /  5:  14.22  13.72   ....   ....   ....   ....   ....   ....   ....   ....   ....
 28-OCT-2010 02:30 /  6:  14.21  13.78   ....   ....   ....   ....   ....   ....   ....   ....   ....
 28-OCT-2010 03:30 /  7:  14.21  13.76   ....   ....   ....   ....   ....   ....   ....   ....   ....
 28-OCT-2010 04:30 /  8:  14.09  13.79   ....   ....   ....   ....   ....   ....   ....   ....   ....
 28-OCT-2010 05:30 /  9:  14.01  13.77   ....   ....   ....   ....   ....   ....   ....   ....   ....
 28-OCT-2010 06:30 / 10:  13.89  13.76   ....   ....   ....   ....   ....   ....   ....   ....   ....
yes?
O.K.! That looks good. The 10m data got written. Now to fix it for production. This deployment was a special case where the 1m data start after the 10m data. Typically, it's most convenient to have all of the microcats have the same deployment start time. This makes the follow on data processing much simpler.
All of the deployment start times in SSDS_METADTA for the M1 201010 deployment were adjusted to be the same as the start time for the Mooring deployment. Performing this step is now part of the standard operating procedure for performing mooring turns. Once SSDS_METADATA has been updated the individual instrument netCDF files must be created by DStoNetCDF.pl before combineTS.pl in run.
D. Examining the gridding method
There are still some problems with gappy data at 40m and below in the _TS file. To debug these we'll make another copy of the OS_MBARI-M1_20101027_R_TS.jnl to /tmp and edit it to go through the processing of the 40m data saving the data to a netCDF file in /tmp so as not to disturb the production processing. We also comment out all of the "CANCEL DATA 1" statements so that we can examine data from the files. This file is executed and we see no errors. We need to examine the input data and the Ferret variables that are constructed for the gridding. Here are the commands from the .jnl that perform the the gridding for the 40m data:
!
! Remove temperature outliers before gridding
!
LET Temperature_QFLAG = IF Temperature GT 2 AND Temperature LT 20 THEN 1 ELSE (-99999)
SET VAR/BAD=-99999 Temperature_QFLAG
LET Temperature_QC = Temperature_QFLAG * Temperature
!
! Compute my own mean of the data, making sure to assign missing values in the gaps in the Gap FLAG
! Allow at least 1 data point in each destination cell - there are usually 6 for 10 minute data
!
LET Temperature_GOOD = Temperature_QC[gt=TIME@SUM] / Temperature_QC[gt=TIME@NGD]
LET Temperature_GFLAG = IF Temperature[gt=TIME@NGD,gz=DEPTH@XACT,gy=LATITUDE,gx=LONGITUDE] LT 1 THEN (-99999) ELSE 1
SET VAR/BAD=-99999 Temperature_GFLAG
LET TEMP = Temperature_GFLAG * Temperature_GOOD[gz=DEPTH@XACT,gy=LATITUDE,gx=LONGITUDE]
Here are some sample Ferret commands for plotting these data from the session that just executed the OS_MBARI-M1_20101027_R_TS.jnl script:
yes? go "OS_MBARI-M1_20101027_R_TS.jnl"
<snip>
yes? set region/t=1-may-2011:1-jun-2011
yes? plot Temperature_QC
yes? plot/ov/symbol=1 temperature
yes? set win 2
yes? plot Temperature_QC[gt=TIME@NGD]
yes? plot TEMPERATURE_QC[GT=TIME@SUM]
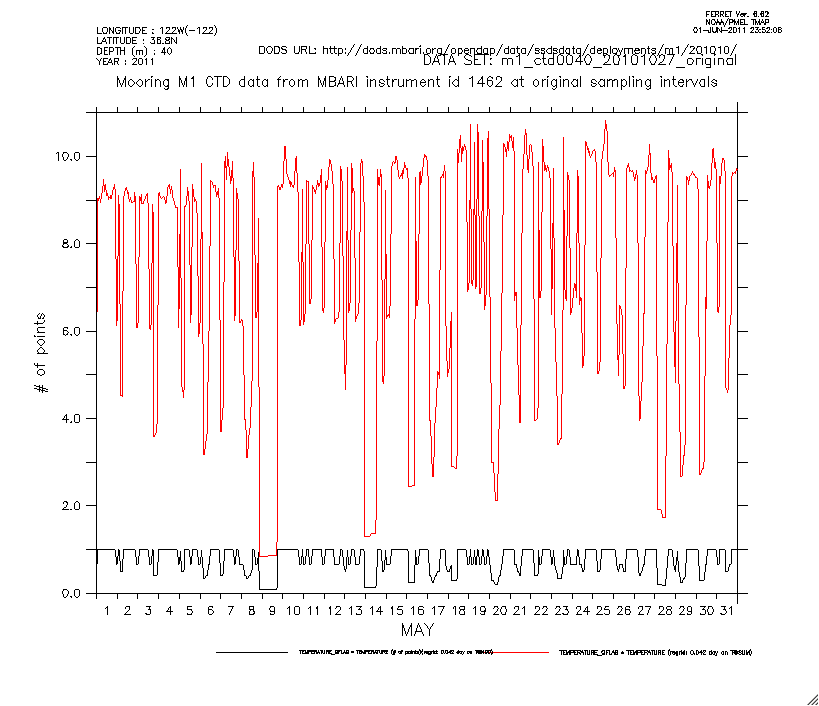
These last two plot commands indicate the source of the problem of the gappy data from the inductive modem microcats. Another big clue is the comment in the .jnl file referring to the 10-minute input data and having at least 6 good values within each gridding cell. As can be seen in the plot we often have less than 1 for the @NGD value for the 40m data. These data are hourly and we should be using a different gridding algorithm for them.

The October 2010 M1 deployment was the first one where all the inductive modem connected CTDs were logged as separate instruments, and the first deployment where the serial microcat processing software was used to process the inductive modem microcat data. The fix for this problem appears to be to do a different gridding for the hourly data from 40m and below. This change was implemented in the code on 2 June 2011 using the Ferret same gridding transform (@MAX) that was previously used for the inductive modem data processing. Here is the after figure:

The subsurface data looks a lot better, but there are still some gaps. If the gaps extend across the whole water column encompassing both the inductive modem and serial microcats then perhaps the gap is due to an interruption in data processing through oasisToSSDS. This can be remedied by reprocessing the telemetered data by following the README instructions in /u/ssdsadmin/dev/DPforSSDS/oasis/scripts on elvis.
E. Testing the results of the gridding
It is worthwhile to do another check on the quality of the gridding that is now being performed. The following Ferret exercice will show the input data compared to the gridded data.
USE "http://dods.mbari.org/opendap/data/ssdsdata/deployments/m1/201010/OS_M1_20101027hourly_CMSTV.nc"
SET REGION/T="29-May-2011 18:13":"02-Jun-2011 18:13"
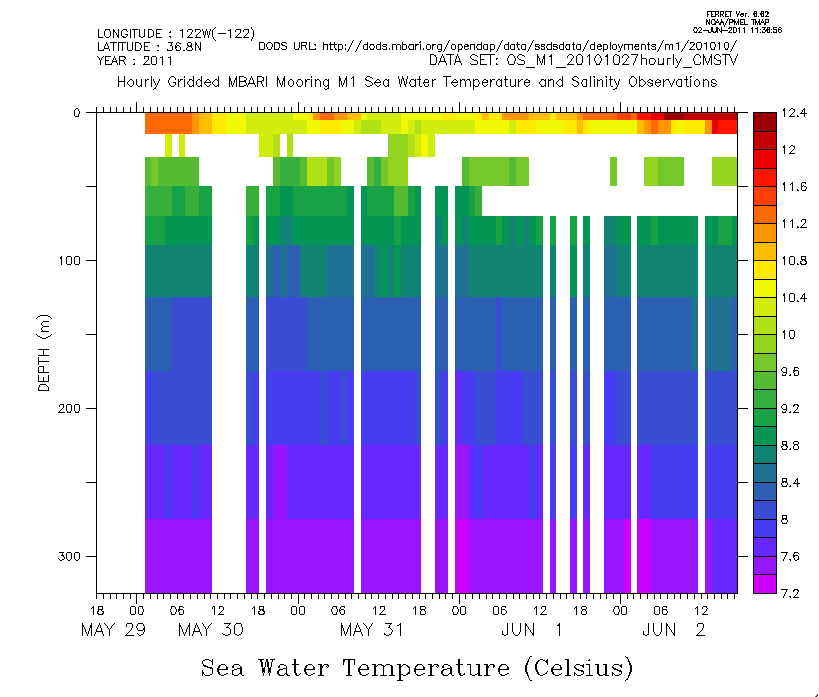
shade SEA_WATER_TEMPERATURE_HR
set win 2
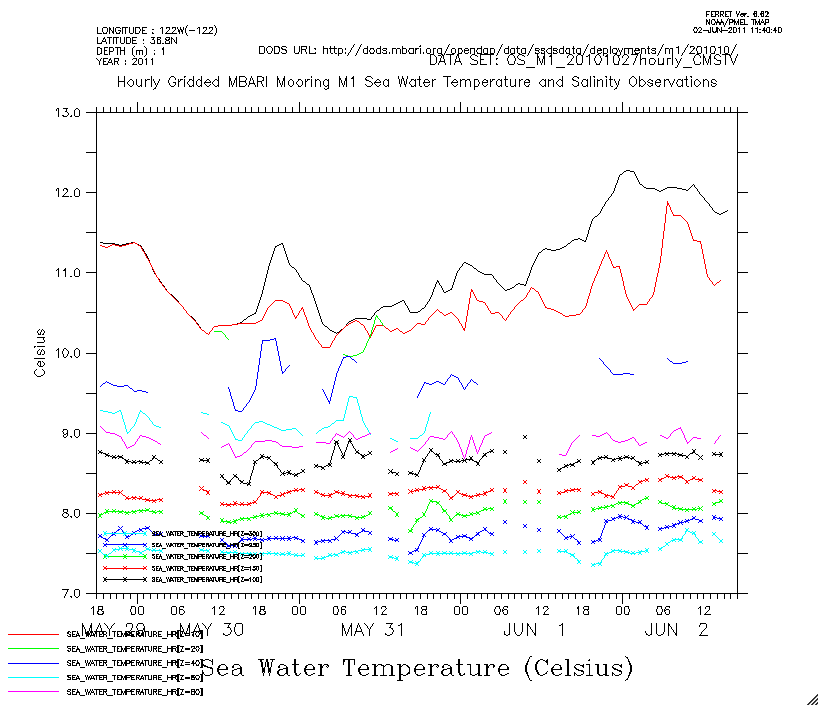
plot/k=1/vlimits=7:13 SEA_WATER_TEMPERATURE_HR
repeat/k=2:11 plot/ov SEA_WATER_TEMPERATURE_HR
Produces these images showing missing data, especially from the 20m and 40m microcats:


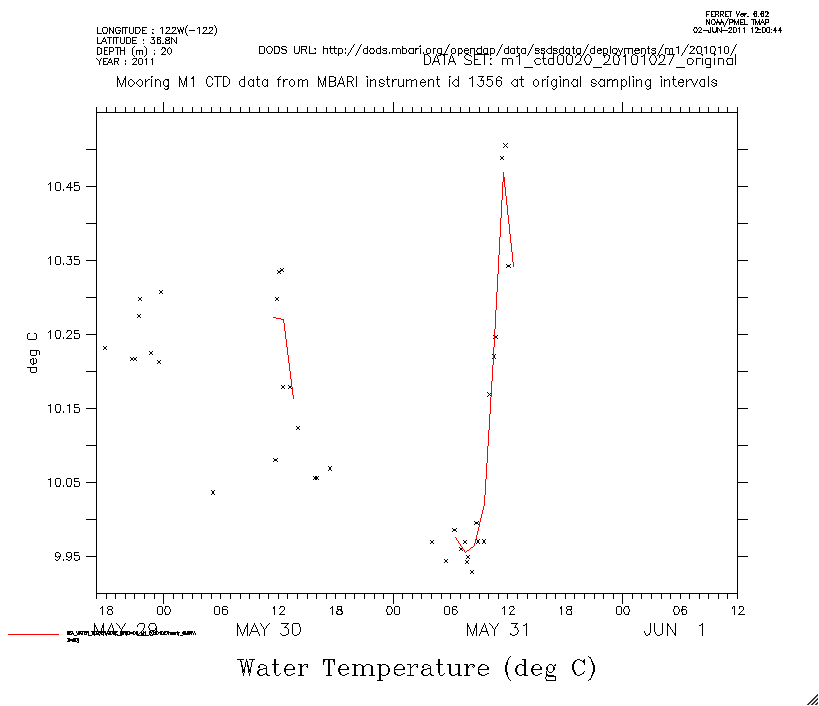
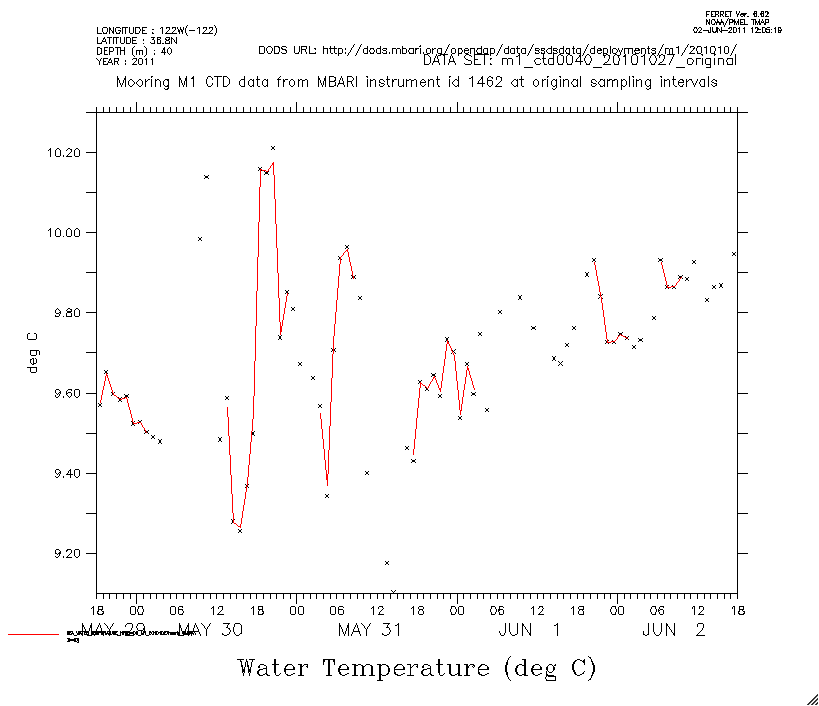
Let's compare the original instruments date from 20m and 40m to the gridded product, using the same Ferret session from above:"
use "http://dods.mbari.org/opendap/data/ssdsdata/deployments/m1/201010/m1_ctd0020_20101027_original.nc"
plot/symbol=1 temperature[d=2]
plot/ov SEA_WATER_TEMPERATURE_HR[k=3,d=1]

use "http://dods.mbari.org/opendap/data/ssdsdata/deployments/m1/201010/m1_ctd0040_20101027_original.nc"
plot/symbol=1 temperature[d=3]
plot/ov SEA_WATER_TEMPERATURE_HR[k=4,d=1]
Gives:


We obviously still have some gridding issues...
F. Rinse and repeat
Now is the time to iterate using our method of starting with the .jnl file that aggregates and grids the data to the OceanSITES _TS.nc file going back to step D.
 m1_ngd_sum.gif (image/gif)
wind_SEA_WATER_TEMPERATURE_HR_last30_before.gif (image/gif)
wind_SEA_WATER_TEMPERATURE_HR_last30_after.gif (image/gif)
m1_lines.gif (image/gif)
m1_lines.gif (image/gif)
m1_shade.gif (image/gif)
m1_compare_20.gif (image/gif)
m1_compare_40.gif (image/gif)
m1_ngd_sum.gif (image/gif)
wind_SEA_WATER_TEMPERATURE_HR_last30_before.gif (image/gif)
wind_SEA_WATER_TEMPERATURE_HR_last30_after.gif (image/gif)
m1_lines.gif (image/gif)
m1_lines.gif (image/gif)
m1_shade.gif (image/gif)
m1_compare_20.gif (image/gif)
m1_compare_40.gif (image/gif)